Could a wearable muscle-oxygen sensor on your left thigh tell a different story from one on your right? A controlled treadmill experiment published in October 2026 tested that question with two sensors, two visits and three running intensities. Across the group, the dominant and non-dominant legs showed almost identical average oxygen-saturation readings. Yet the spread between individual legs was surprisingly wide. For runners interested in smarter training data, both findings matter: one sensor may be useful for tracking a consistent site, but a single unusual number is not a diagnosis of an imbalance.
The 48-person treadmill experiment
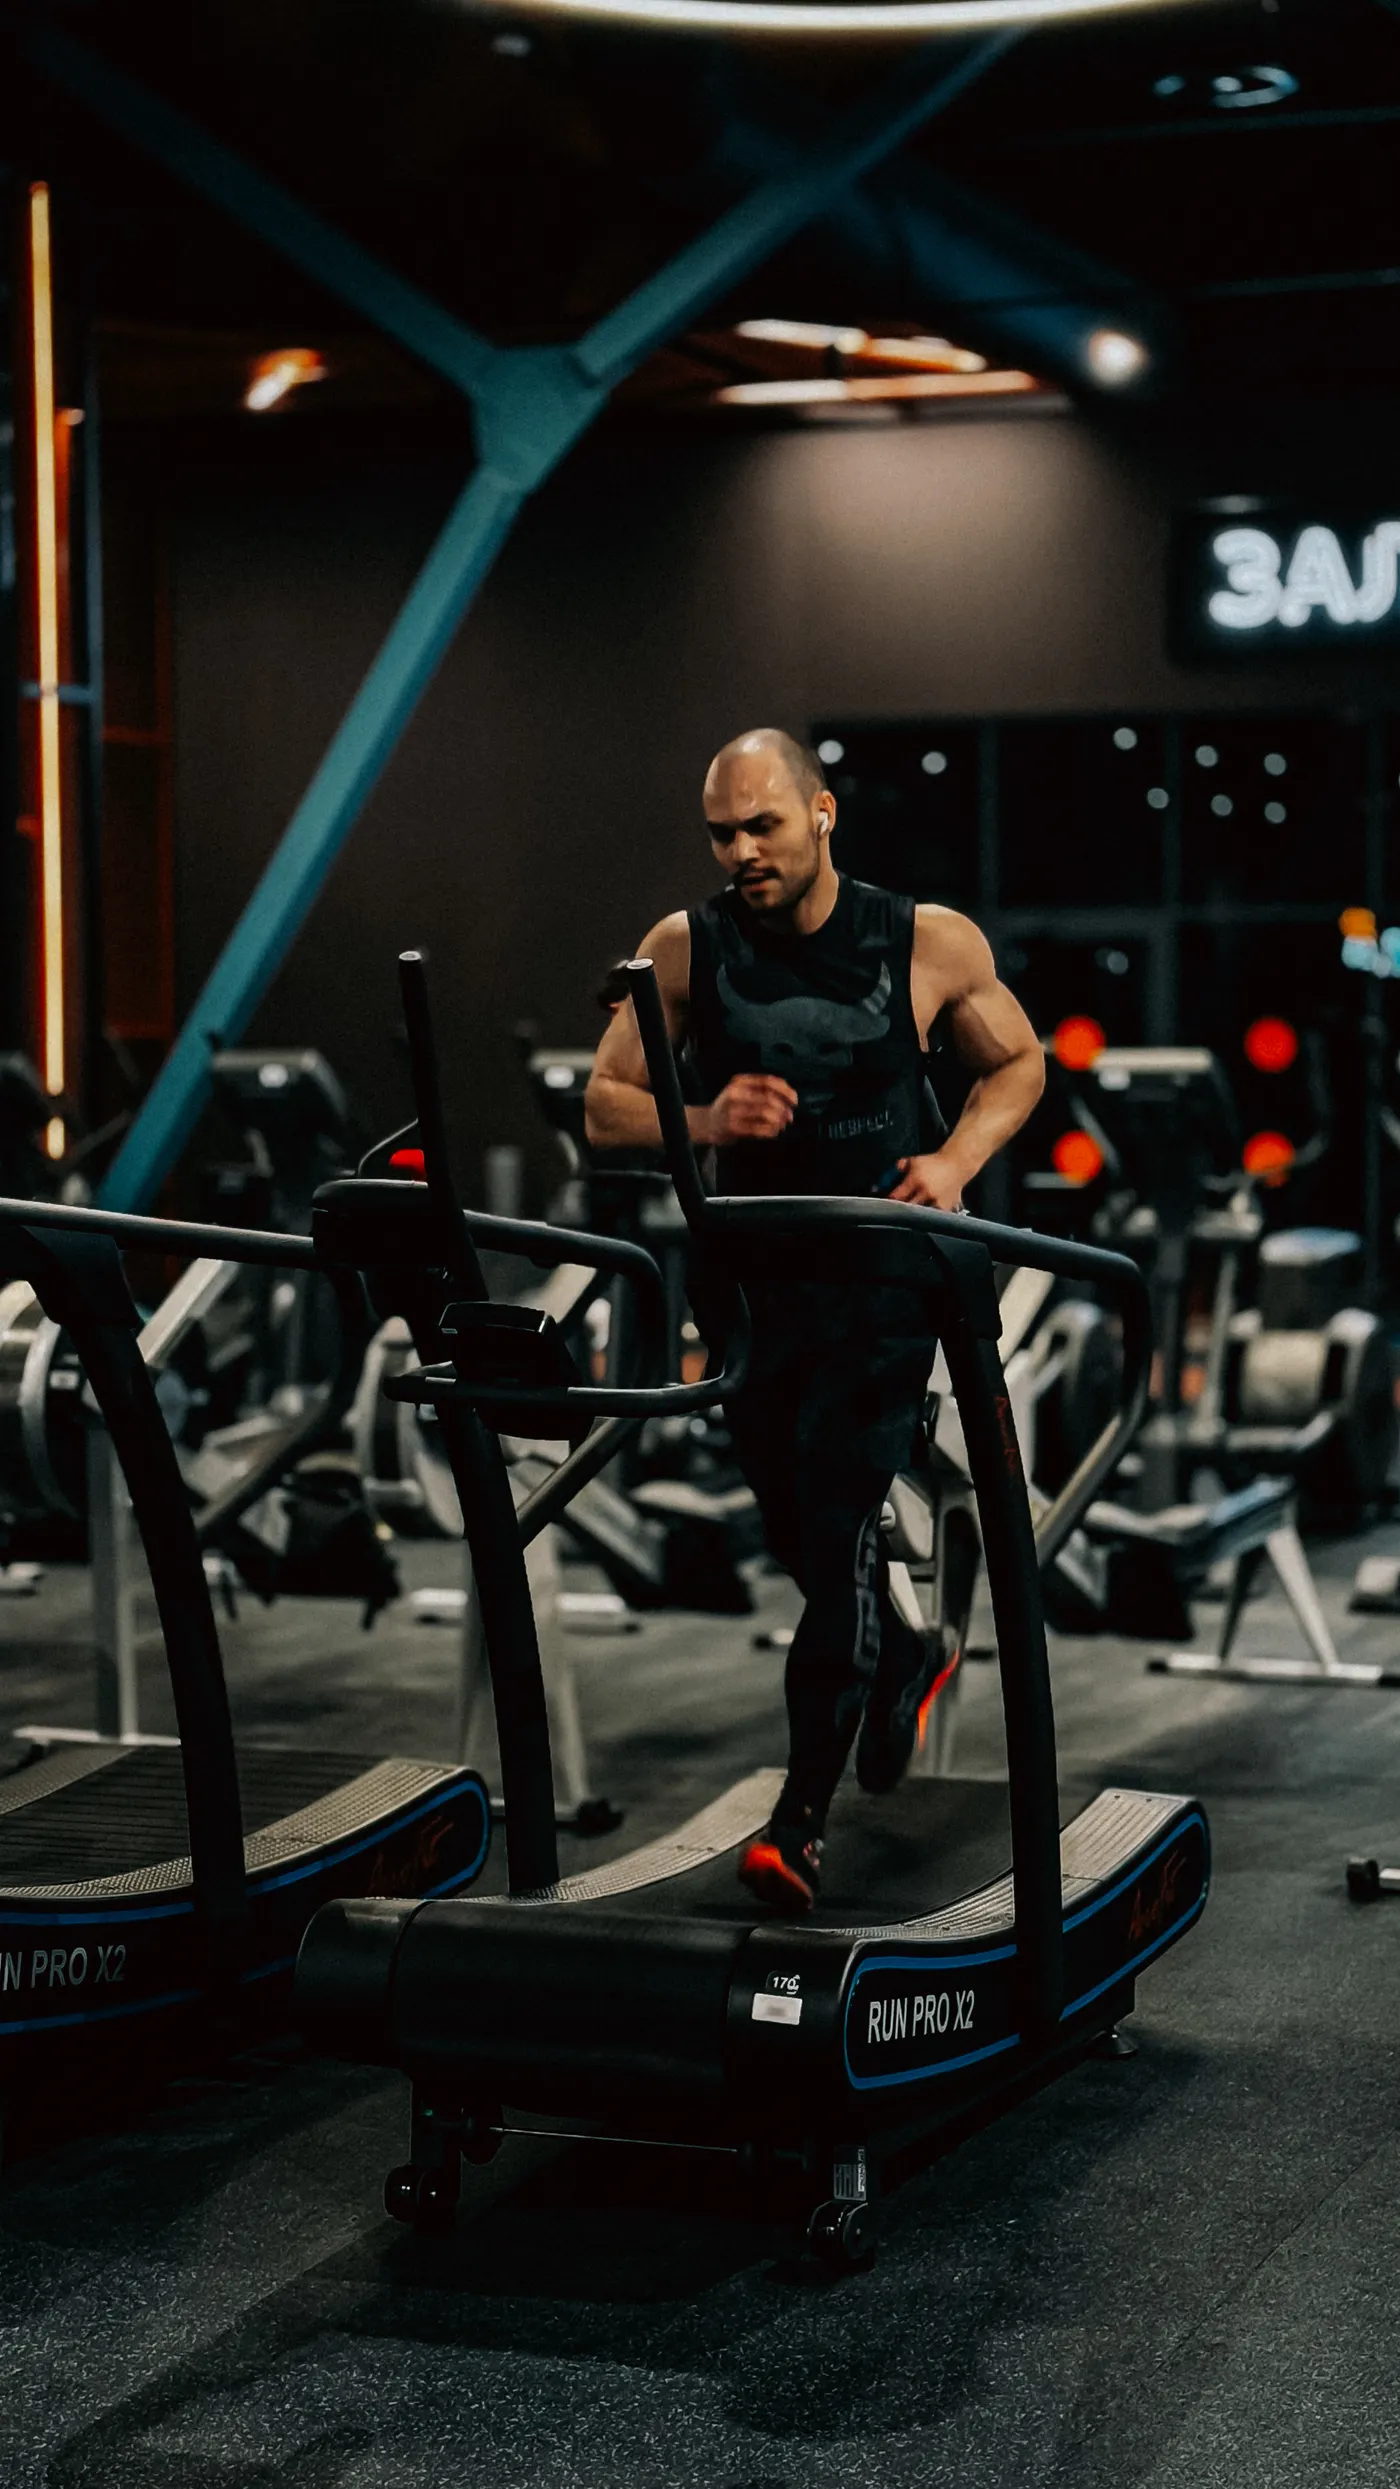
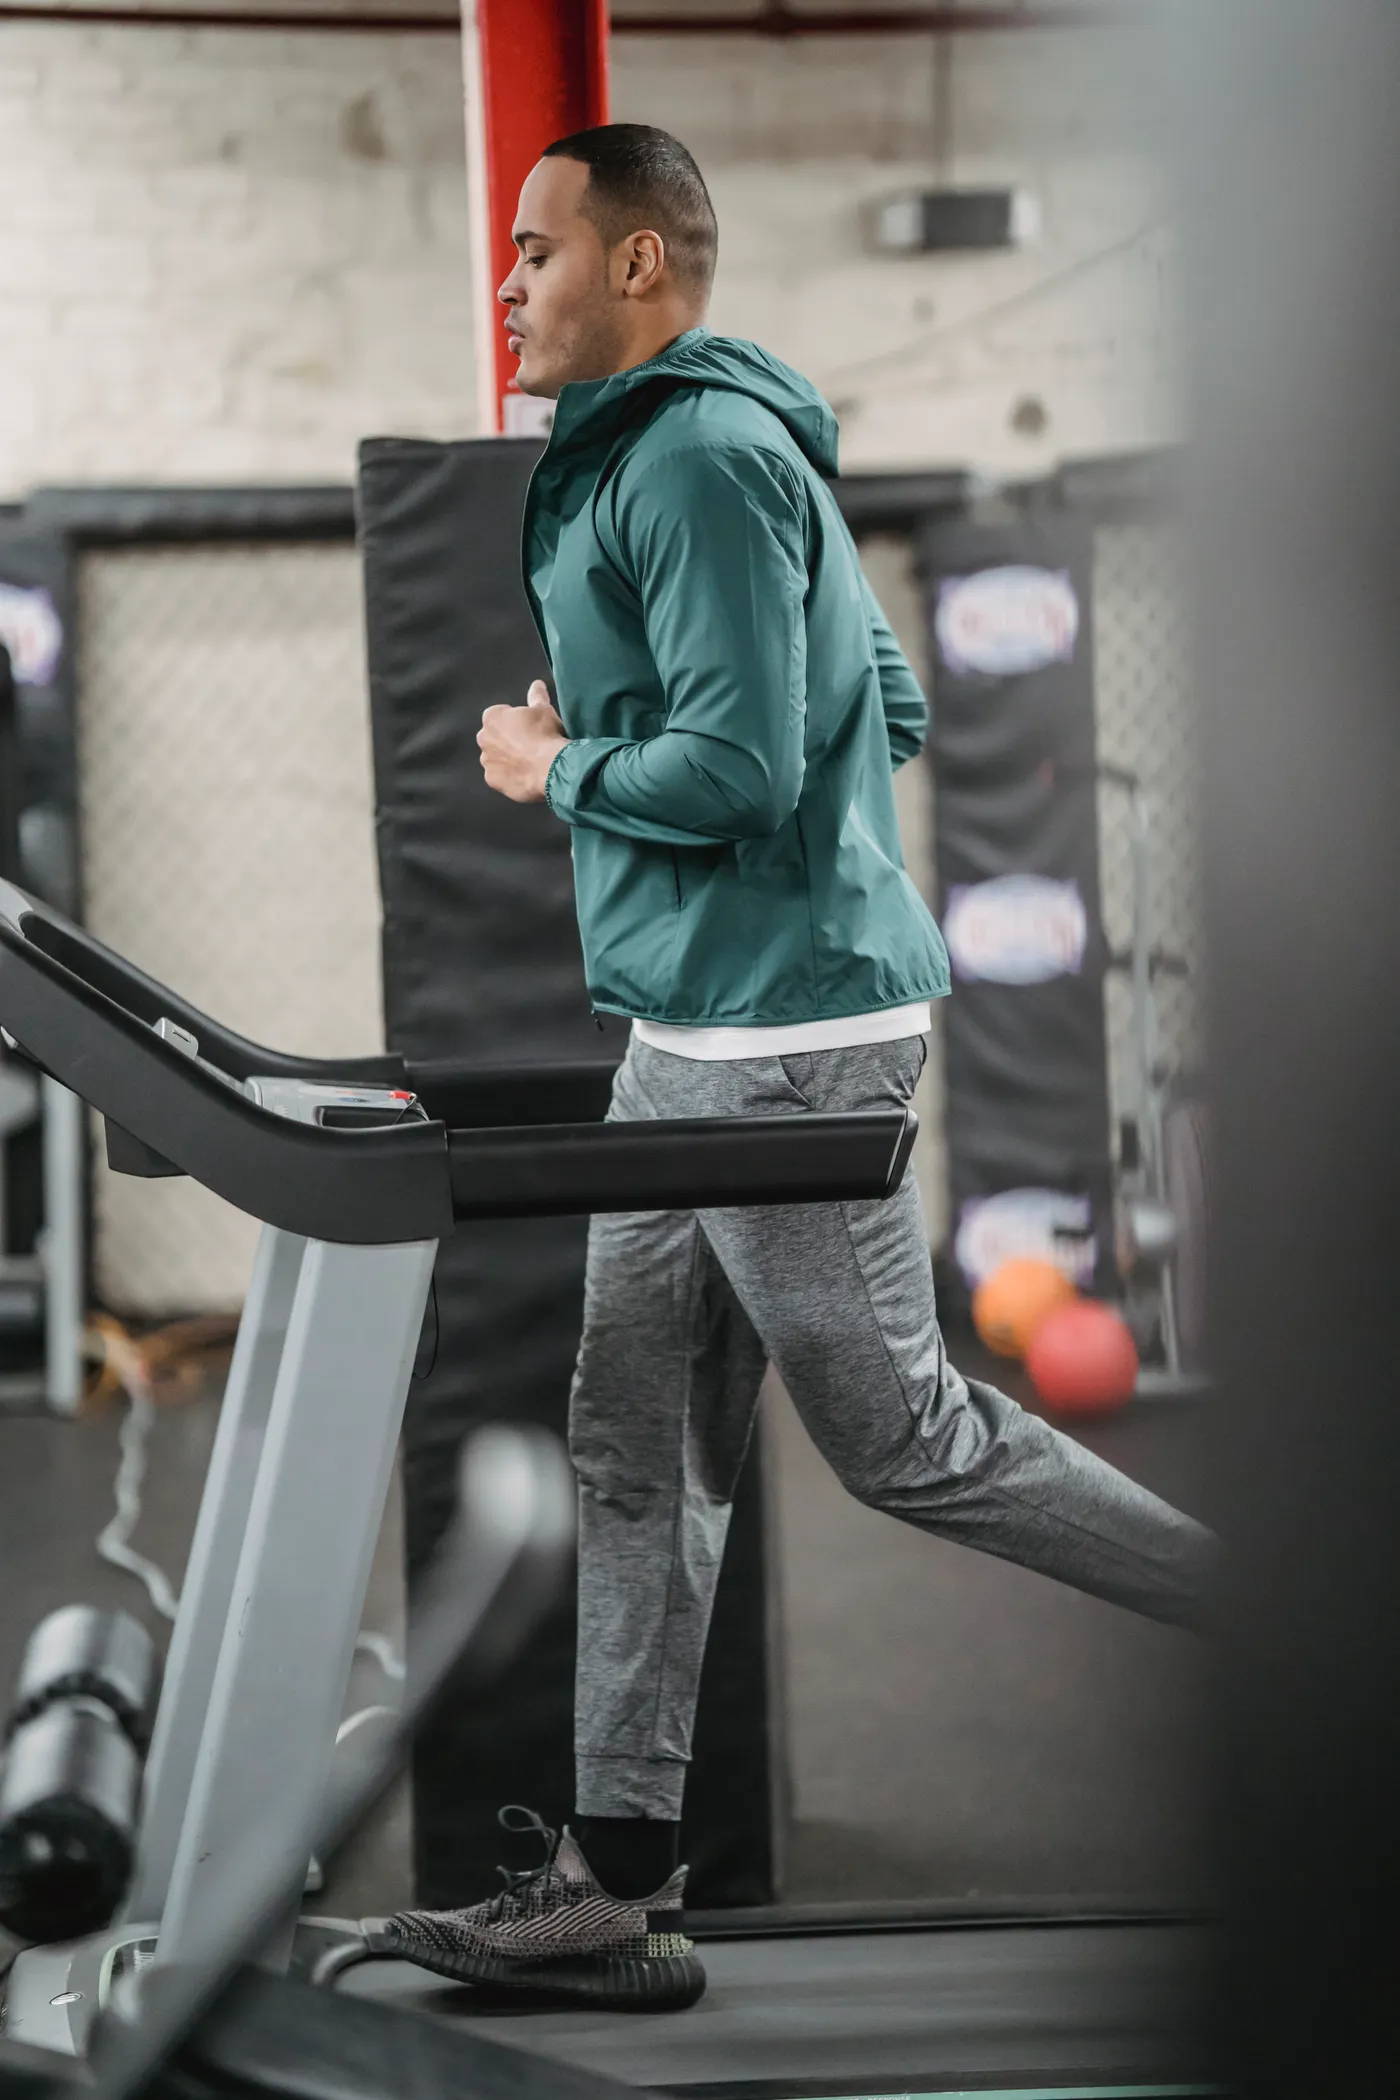
The investigators recruited 48 young adults, including 20 women, with an average age of about 22. Each participant completed two graded treadmill tests roughly two weeks apart. Small optical sensors were attached to the outer quadriceps muscle on both legs. The devices measured an estimate of local muscle oxygen saturation, usually shortened to SmO2, while the treadmill speed increased in stages.
Running began at 6 km/h on a one-percent incline. Speed increased by 2 km/h every three minutes, with brief recovery intervals for blood-lactate sampling. Rather than comparing everyone at the same absolute speed, the researchers classified observations into low, middle and high intensity relative to each person’s lactate response. That made the side-to-side comparison more meaningful across different fitness levels.
The dominant leg was identified by a simple preferred-kicking-leg test. Importantly, dominance was not assumed to mean greater muscle strength, better running mechanics or a larger oxygen requirement. The experiment asked a narrower question: when both thighs are measured under the same conditions, does the dominant side systematically produce a different optical saturation reading?
The team also measured skinfold thickness near the sensors. This matters because the light passes through skin and subcutaneous tissue before reaching muscle. The setup was carefully controlled, but it was still a laboratory treadmill test of young adults, not a trial showing how wearable-guided training changes race times or prevents injury.
The main finding: almost no average left-right bias
The group-level result was clear. The statistical analysis found no significant main effect of leg dominance on SmO2, with a reported p-value of 0.759. The average difference between dominant and non-dominant legs was only about minus 0.34 percentage points. There was also no meaningful interaction between side and the three individualized workload categories.
At low, middle and high workloads, estimated mean saturation values for the two legs were closely aligned. For the whole sample, dominant-side averages were approximately 52.4, 53.9 and 54.3 percent; non-dominant-side averages were 52.5, 54.6 and 54.4 percent. These numbers are device-derived local readings, not the percentage of oxygen in the blood and not a universal target for runners.
The practical interpretation is that leg dominance alone did not predict a consistently higher or lower thigh oxygen signal. That is encouraging for someone who owns one sensor and wants to monitor the same muscle across repeated sessions. It does not establish that either leg can always substitute for the other in an individual athlete.
Group averages can hide substantial variation. The important second half of the result is how far individual paired measurements could diverge, even when the overall mean difference hovered near zero. A small average bias and close agreement for every runner are two very different claims.

Equipment Worth Exploring
Explore equipment, accessories and gear from our carefully selected range.

Apple Watch Ultra 3
Rugged 49 mm smartwatch with cellular connectivity, GPS and fitness tracking.

Powerbeats Fit
Secure-fit wireless workout earbuds with active noise cancellation and a charging case.


VOLTRA
Compact digital cable trainer with smooth, adjustable resistance.

Go-Tone Pro
Portable digital cable trainer with up to 66 lb (30 kg) of adjustable resistance.


Power Tower
Freestanding pull-up and dip station with adjustable handles for bodyweight training.

Why an individual runner can still see a big gap
When the researchers examined agreement between legs, the limits were broad: roughly minus 19.6 to plus 18.9 percentage points for the full sample. In plain language, the absence of a consistent average difference did not mean that every pair of sensors displayed nearly the same number. Some individual comparisons were much farther apart.
That spread could reflect genuine differences in local muscle recruitment or oxygen handling. It could also reflect sensor positioning, movement artefacts, skinfold differences, optical signal behavior or how well the device remained attached during running. The study was not designed to separate every one of those explanations, so it would be a mistake to label a large reading gap as proof of a weak leg.
Imagine seeing 55 percent on one thigh and 43 percent on the other during a hard interval. The temptation is to prescribe extra single-leg squats or change running form immediately. Neither action follows from one pair of optical readings. First repeat the comparison at a similar speed, sensor position and level of fatigue, and ask whether the difference persists.
Earlier cycling work also found little systematic dominance bias but wide side-to-side limits. A broader review of running asymmetries found inconsistent relationships between inter-limb differences and performance. Those findings support a restrained approach: asymmetry is a description of a measurement, not automatically a problem to correct.

Cardio Shirts & Workout Gear
Cardio and conditioning gym gear for runners, endurance athletes and anyone who earns the sweat.

Running Dost Thou Even Trot Medieval Treadmill Crewneck T-Shirt
Show some gym-day personality with “Running”.

Cardio Heartbeat Hoodie
Show off your cardio humor in a laid-back “Cardio Heartbeat” hoodie.

Hybrid Athlete – Iron Man Medieval Triathlon Gym Shirt T-Shirt
Make gym days more fun with “Hybrid Athlete” style.


Track Panther Crewneck Pullover for Running Workout Fan T-Shirt
Keep things casual with a little “Track Panther” attitude.

Anti Running Club Tee
Heavy lifts, good laughs, and a little “Anti Running Running Club” energy.

Cardio Is Calling Decline Vest Meme Tank Top
Show some personality between sets with “Cardio Is Calling”.

Cardio Is Hardio – Workout Meme Hooded Pullover Hoodie
Keep it laid-back with a little “Cardio Is Hardio” attitude.

Jump Rope Wonder Woman | Superhero Cardio Workout Pullo Hoodie
Keep it laid-back with a little “Jump Rope Wonder Woman” attitude.

Exercise Your Demons | Cardio Workout From Hell Graphic T-Shirt
Show some cardio attitude with a playful “Exercise Your Demons” tee.
Skinfold thickness complicates the oxygen signal
One of the most useful details was the way local tissue thickness related to the intensity response. Participants were divided using a seven-millimeter adipose-tissue-thickness threshold at the sensor site. In the thinner-tissue subgroup, the signal generally fell as workload rose, a pattern compatible with increasing local oxygen extraction during demanding exercise.
In the thicker-tissue subgroup, however, the average recorded saturation moved in the opposite direction as running intensity increased. The investigators considered that physiologically unexpected and discussed the possibility that the optical signal was being influenced more by overlying tissue, skin blood flow and other measurement factors. It would be wrong to infer that these runners’ muscles suddenly needed less oxygen as they ran faster.
A separate 2026 treadmill investigation involving 157 adults also found site-specific associations between skinfold thickness and wearable SmO2 readings. Its statistical adjustment improved comparisons under a common tissue-thickness reference, but did not physically correct the light signal or establish perfect measurement validity. Together, the studies explain why comparing absolute sensor numbers across different people can be especially misleading.
For personal tracking, consistent placement on the same muscle is usually more informative than chasing someone else’s saturation value. Record the exact position, strap tension, clothing, environmental conditions and exercise intensity. Even with careful setup, treat the number as one imperfect signal among several.
What a muscle-oxygen wearable does and does not measure
Near-infrared spectroscopy shines light into tissue and estimates the relative oxygenation of light-absorbing molecules such as hemoglobin and myoglobin. It offers a window into local muscular demand that heart rate alone cannot provide. But the output is an optical estimate from a particular patch of tissue, not a direct measurement of whole-body oxygen consumption, blood oxygen saturation or muscle growth.
That distinction matters when comparing a thigh sensor with a smartwatch. Heart rate reflects cardiovascular response; pace and incline describe external workload; perceived effort tells you how demanding the session feels. A local oxygen signal may add context, but it cannot replace those measures or independently establish your lactate thresholds.
Sensor reliability also depends on intensity and movement. Earlier validation work found that a portable muscle-oxygen monitor behaved more consistently at low and moderate cycling intensities than at the hardest workloads. In the new running experiment, eight of 576 expected measurements were missing because a sensor detached during treadmill exercise. Even a small amount of lost data reminds us that real-world attachment and motion are part of measurement quality.
More numbers do not automatically mean more insight. A runner who can consistently record pace, duration, heart rate and session effort may make better training decisions than someone constantly changing sessions in response to noisy local readings. Use muscle oxygenation to investigate a specific question, not to replace the basic training log.
Equipment Worth Exploring
Explore equipment, accessories and gear from our carefully selected range.


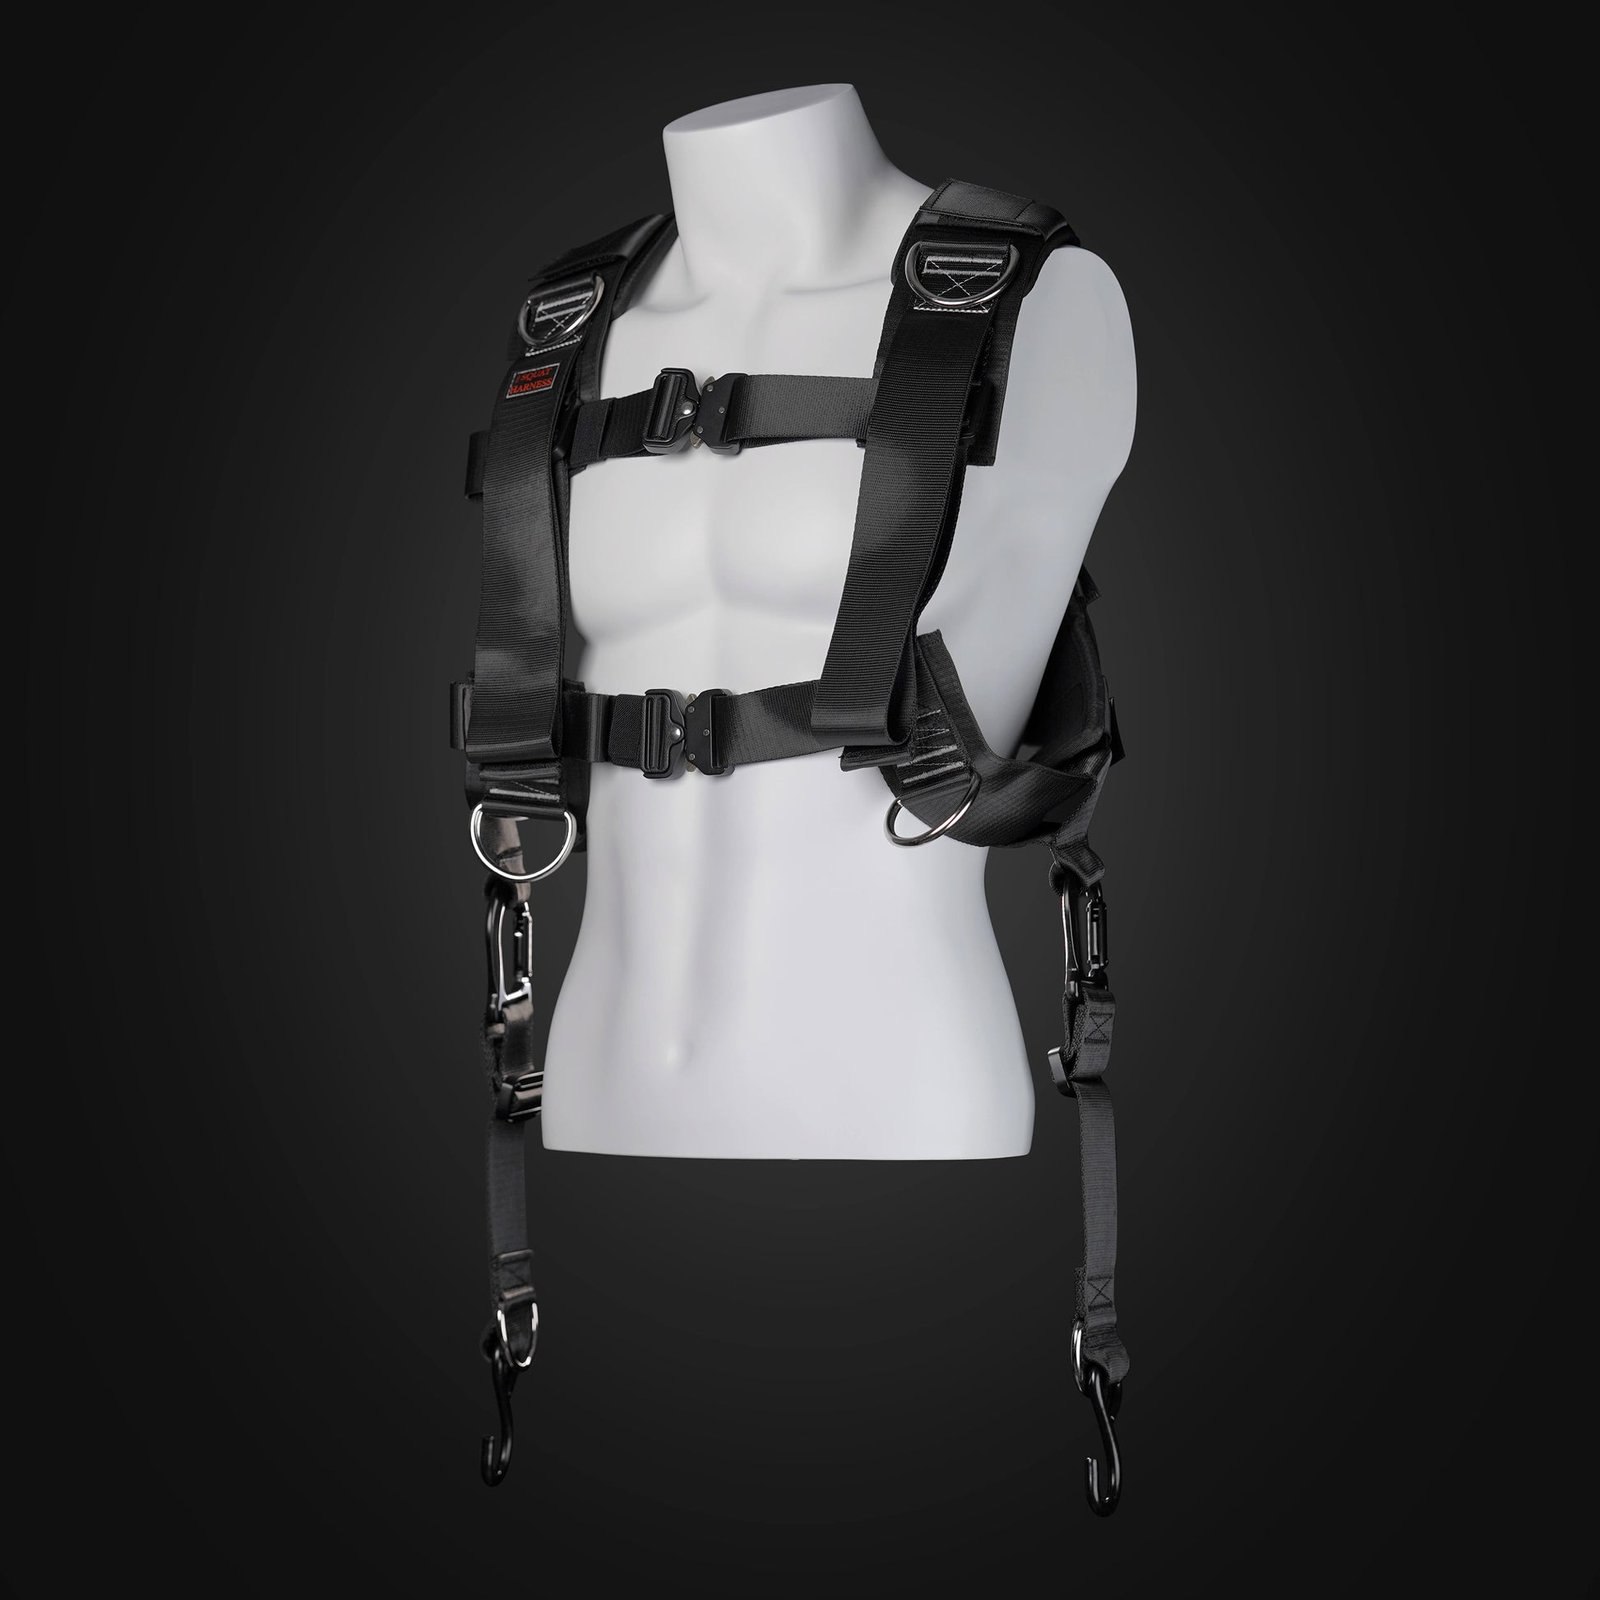
Squat Harness
Wearable harness for hands-free cable squats, sled work, and lower-body training.
GymPin D Cuffs
Adjustable wrist cuffs with textured grips for supported cable-machine exercises.


FID Bench MAX
Adjustable bench offering flat, incline, and decline positions + adjustable headrest.
GymPin Starting Blocks
Portable high-density foam blocks for adjusting machine starting positions and range of motion.

Leather Wrist Grips
Padded leather lifting grips help support the hands and wrists on heavy pulling exercises.


Leather Lifting Straps
Padded leather straps support grip during heavy rows, deadlifts and pulling exercises.
A sensible four-week monitoring experiment
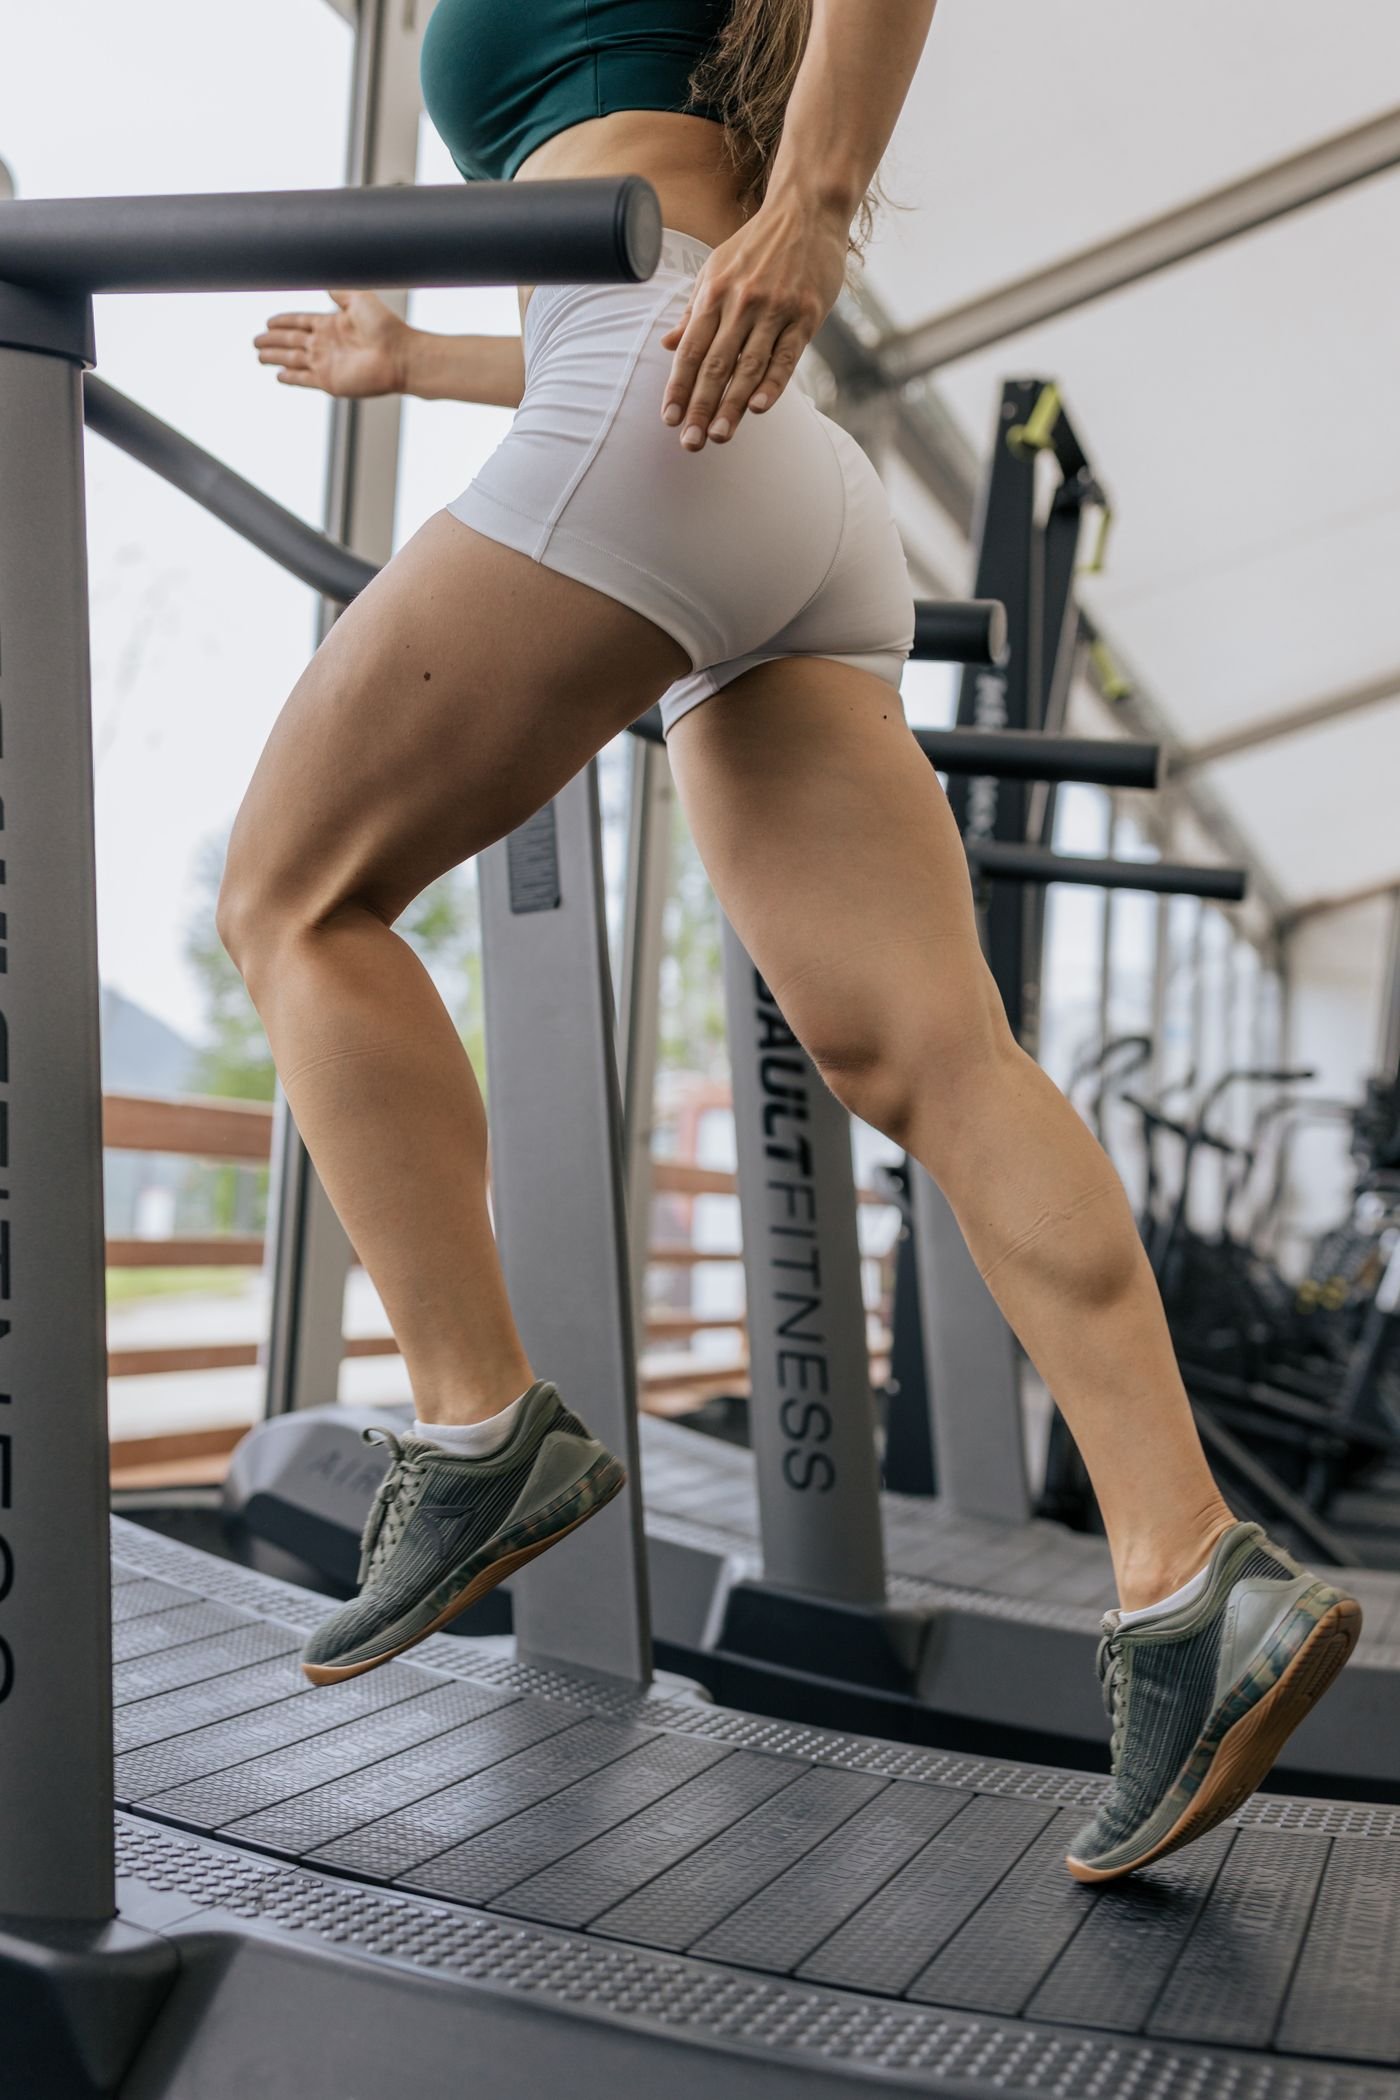
If you already have access to a muscle-oxygen sensor, start with a repeatable baseline instead of a maximal test. Choose a treadmill or flat route, a familiar pair of shoes and a stable sensor location on the outer thigh. Warm up for ten minutes. Then complete three six-minute blocks at easy, steady and comfortably hard effort, separated by three minutes of easy movement. Record the final two minutes of each block.
In week one, perform the protocol once and record pace, heart rate, perceived effort and the sensor’s average reading. In week two, repeat it at approximately the same time of day and with similar recovery. Do not increase intensity merely to make the oxygen graph look dramatic. Your first goal is to understand ordinary day-to-day variation.
In week three, if you have two devices, compare the legs using carefully matched placement and the same workload. Repeat the comparison rather than reacting to a single gap. In week four, return to the original single-leg setup and assess whether readings are stable enough to add useful context to your training log. A device that changes unpredictably with placement or sweat may be better used for occasional experiments than daily decisions.
Keep the rest of your training normal. Two or three easy runs, one controlled quality session and strength work appropriate to your experience can coexist with this experiment. If the readings are erratic, prioritize repeatable pace, heart rate, perceived exertion and recovery. Never change injury rehabilitation, medication or medical decisions based on a consumer muscle-oxygen reading alone.
Functional Fitness Shirts & Workout Gear
Functional-fitness shirts, tanks and workout gear for athletes who train strength, conditioning and everything in between.

Hybrid Athlete – Strength & Endurance Gym Pullover for Hoodie
Keep it laid-back with a little “Hybrid Athlete” attitude.

Gym Dost Thou Even Pedal Medieval Air Bike Joke for Cro T-Shirt
Show some gym-day personality with “Dost Thou Even Pedal Medieval Air Bike Joke”.


Viva La Resistance Bands , Meme Shirt, Top T-Shirt
Make gym days more fun with “Viva La Resistance Bands” style.

OnlyGains Kettlebell Meme Decal Water Bottles & Sticker
Stick a little “OnlyGains” humor on your favorite gear.


Anti HYROX HYROX Club Meme Shirt Gymbro T-Shirt
Make gym days more fun with “Anti HYROX HYROX Club” style.

The limits and the useful takeaway for runners
The experiment did not test whether correcting an oxygen-saturation asymmetry improves running economy, prevents injury or makes an athlete faster. It did not establish an ideal SmO2 range, compare every available wearable or follow athletes through months of training. The sample consisted mainly of young sport-science students, and the sensors were placed on one quadriceps site rather than across the entire leg.
Participants’ training and diet between the two tests were not tightly controlled. Individual sensor placement and local tissue thickness could influence readings. Some sensors detached during exercise. These are ordinary research limitations, but they become important when a marketing claim turns a device output into an apparently precise measure of readiness or muscle balance.
There is also a difference between left-right oxygen readings and left-right mechanical loading. A runner can have different ground-contact times or forces without displaying a consistent difference in local thigh oxygen saturation. Conversely, an unusual optical reading does not prove altered force production. Investigating pain, weakness or a persistent performance change requires a broader assessment than a sensor alone can provide.
The strongest conclusion is deliberately modest. In 48 young adults running at three relative intensities, the dominant and non-dominant thighs did not differ systematically in average muscle-oxygen readings. Individual differences remained wide enough to demand caution. For home-gym and endurance enthusiasts, the winning approach is consistent measurement, realistic expectations and training decisions based on repeatable performance rather than one attractive graph.